2 Data files and formats
Chapter overview
This chapter first considers what data means in the context of language research, before turning to how these data are formatted and stored. You will learn about:
- Different types of data used in language research
- Computer data formats and file extensions
- Sharing and accessing research data and materials
- Working with delimiter-separated values (DSV) files
- The pitfalls of spreadsheet programs such as Microsoft Excel, Numbers, and Google Sheets
Along the way, you will get insights into an eye-tracking study involving cute Playmobil figures and a meta-science investigation that highlights the utmost importance of data literacy for research.
2.1 Data in the language sciences
In this book, we are concerned with empirical research in the language sciences, in other words, with research that is based on the analysis of data. But what are data exactly? Data can be collected via surveys, measurements, or observations. To begin with, however, these collected datasets are “raw”. Data only becomes information once we have analysed and interpreted the data in a meaningful way. Hence, just like uncooked pasta does not make a flavourful meal, we must learn to “cook” the raw data to obtain meaningful information.
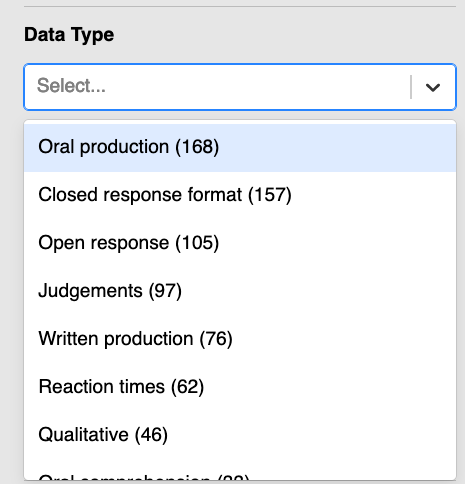
What kind of data are analysed in the language sciences? To get a rough idea of the range of data types analysed in the language sciences, let us take a look at the IRIS database.
IRIS is a collection of instruments, materials, stimuli, data, and data coding and analysis tools used for research into languages, including first, second, and beyond, and signed language learning, multilingualism, language education, language use, and language processing. Materials are freely accessible and searchable, easy to upload (for contributions) and download (for use). (iris-database.org 2011)
As such, IRIS supports Open Science and Open Scholarship (see Chapter 1).
In this task and many future tasks, we will make use of the IRIS database.
- Connect to the IRIS website and navigate to its Search and Download page.
- Scroll down to the filter option ‘Data Type’.
- Click on ‘Data Type’ and browse through the different data types that are most commonly used in language-related research.
Q2.1 For which kinds of studies could these different types of data have been collected? Think about both experimental and observational studies.
Q2.2 Which of these data types is most likely to be measured in milliseconds (ms)?
2.2 Types of research data
Given the wide range of methods used in language research, it is no surprise that they are so many different types of research data (see e.g. Good 2022). Although the data types listed on the IRIS search page (see Figure 2.1 for extract) are very broad and the categories not clearly defined, the list illustrates the breadth of research data types typically analysed in language studies.
The first data type category, “Oral production”, for instance, can equally refer to text transcriptions of language users’ oral production, audio, or video files. It can also refer to either raw data or to (more or less) processed data. For example, a transcript of a conversation could have been automatically annotated for part-of-speech, meaning that every word would be marked for their word class (e.g. This_DT is_VBZ not_RB raw_JJ text_NN data_NN ._PUNC), or it could have been manually anonymised by adding placeholders (e.g. Is <NAME> going out with <NAME>?) indicating that certain words have been retracted for data protection reasons.
The second most frequent data type category, “Closed response format”, includes different kinds of questionnaires and tests. Questionnaires may ask study participants to disclose personal information relevant to the research questions using single or multiple-choice questions, such as what language(s) they use at home, how long they have studied a language for, or how old they are. Tests may be designed to assess participants’ language competences (e.g. in the form of a vocabulary or grammar test), as well as other aspects relevant to the research questions being investigated (e.g. short-term memory or baseline reaction times).
In this book, we will focus on the research processes that take place after the data have been collected. However, it is vital that we are aware of the conditions and context in which the data we are analysing were collected and pre-processed. It is no exaggeration to say that these steps in the research process can entirely change the results of the data analysis. Suppose we decide to compare the abilities of two groups of French L2 learners. To do this, we administered a language production test to two whole classes of secondary school students learning French as a second language using two different teaching methods. If one group had 15 minutes to complete the test and the other had up to 60 minutes, the results would not be comparable.
Q2.3 Which other reasons could potentially jeopardise the comparison of test results data from two different groups of pupils?
Whilst there are many ways to ensure that as many factors as possible are controlled for, not all can be controlled for. What is crucial is that all aspects of the data collection process are well documented so that all factors, whether controlled or not, can be taken into account when analysing the data.
In research, we usually distinguish between primary data, which are the data that you collected yourself, and secondary data, which are data that were collected by others. Hence if you were to carry out a new study based on data that you found on IRIS, you would be conducting a secondary data analysis. Especially when conducting secondary data analyses, it is crucial that we have enough information about the data itself, i.e. metadata. Metadata is crucial for finding, sharing, evaluating, and reusing datasets (Trippel 2025). For some data and projects, it makes sense to create separate metadata files that contain additional or more detailed information about the collected data. For language-related data, various metadata tools and standards exist (see e.g. Paquot et al. 2024; Consortium 2025; Windhouwer & Goosen 2022; Withers 2012) and it makes sense to try to stick to these standards as far as possible to ensure greater comparability and comparability across different datasets (for more information on how to develop a Data Management Plan for a linguistics study, see Kung 2022).
2.3 Data formats and file extensions
Different data types come in different data formats. For audio files, you may be familiar with the MP3 format, but this is by no means the only format in which audio files can be saved. Many other audio file formats exist, such as Waveform Audio File Format (WAVE) and Free Lossless Audio Codec (FLAC).
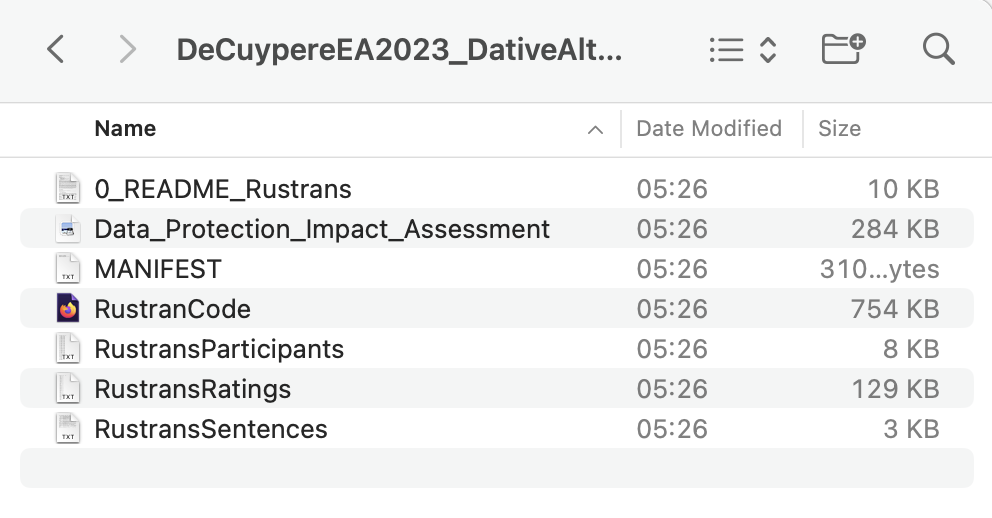
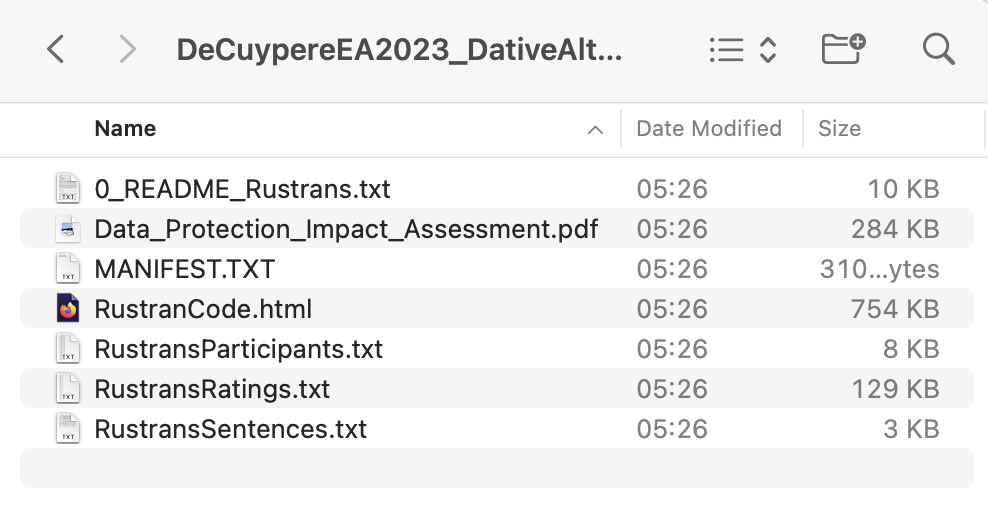
We can usually tell in what format a file is in by looking at its file extension. The file extension is the suffix of the file name. It comes at the end of the file name and is preceded by a dot. The file extension of a WAVE file is .wav, whereas that of an MP3 file is .mp3; hence the file recording.wav is a WAVE file, whereas recording.mp3 is an MP3 file.
Q2.4 In which format are Microsoft Word files typically saved?
Q2.5 Which of these files are audio files?
Unfortunately, many modern operating systems have a tendency to hide file extensions by default. This results in the files recording.wav and recording.mp3 both being displayed as recording in File Finder/Explorer windows (compare Figure 2.2 (a) and Figure 2.2 (b)). This is misleading and can lead to all kinds of problems.
To ensure that you can always see the extensions of the files on your computer in the File Explorer (on Windows) or the File Finder (on macOS), follow these instructions:
- On Windows: https://www.howtogeek.com/205086/beginner-how-to-make-windows-show-file-extensions/.
- On macOS: https://support.apple.com/en-gb/guide/mac-help/mchlp2304/mac (select the version of your operating system at the top of the page).
2.4 Sharing research data and materials
In line with the principles of Open Science (see Chapter 1), it is important to ensure that both the materials that were used to collect research data (e.g. questionnaire items, audio, image or video stimuli, language aptitude tests, etc.) and the data themselves are made openly available to the research community, whenever legally possible and ethically responsible. Sharing materials ensures that studies can be replicated, for example with new participants or in a different language. Sharing research data also allows independent researchers to reproduce the results of studies, allowing them to verify the reported results and to conduct additional analyses that may confirm, contradict, or extend the conclusions of the original studies.
You may be wondering how linguists and language education researchers can make their research data and materials publicly available. Table 2.1 provides a non-exhaustive list of public repositories where researchers can upload research data and materials (with figures collected in early June 20241). Some are specific to the language sciences, while others cater to all research disciplines. All of the examples, tasks, and exercises in this book are based on research data and materials that researchers have made available in open access on one or more of these repositories.
| Repository | Discipline | Nb. of entries | Provides DOI | Online since |
|---|---|---|---|---|
| Dryad | All | 60000 | Yes | 2008 |
| Figshare | All | 8000000 | Yes | 2012 |
| HAL | All | 5000000 | No | 2001 |
| Harvard Dataverse | All | 160000 | Yes | 2006 |
| IRIS | Linguistics | 3500 | No | 2011 |
| Open Science Repository, OSF | All | 153663 | Yes | 2012 |
| Tromsø Repository of Language and Linguistics, TROLLing | Linguistics | 4500 | Yes | 2014 |
| Vivil | Clinical research | 7000 | Yes | 2013 |
| Zenodo | All | 3750000 | Yes | 2013 |
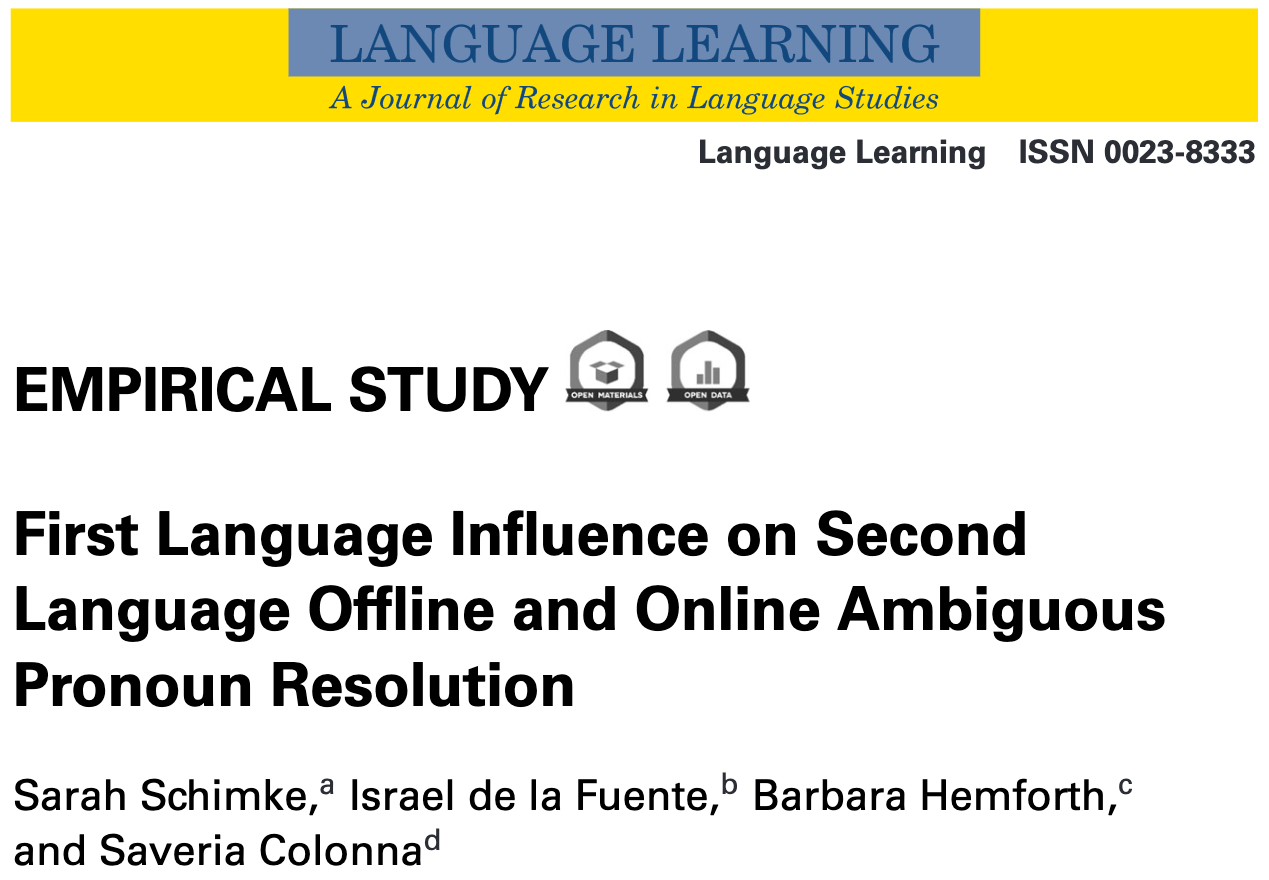
In the following Your Turn! sections, we will look at a study by Schimke et al. (2018) (see Figure 2.3 (a)), which is an example of a publication which was awarded the Open Data and the Open Materials badges (see Figure 2.3 (b)). This means that the research materials and data associated with this study can be found in an open, online repository:
“This article has been awarded Open Materials and Open Data badges. All materials and data are publicly accessible via the IRIS Repository at https://www.iris-database.org/iris/app/home/detail?id=york:934337. Learn more about the Open Practices badges from the Center for Open Science: https://osf.io/tvyxz/wiki” Schimke et al. (2018).
The authors could have chosen to upload their materials and data to any of the online repositories listed in Table 2.1 but, in this case, they chose IRIS.
Among other results, Schimke et al. (2018) report on two eye-tracking experiments. One of these experiments involved Spanish-speaking participants listening to ambiguous sentences in Spanish whilst looking at images of Playmobil figures (see Figure 2.4 for an example).
In this eye-tracking experiment, participants were instructed to decide whether the sentences they heard matched the Playmobil images or not. Consider the following two sentences from the experiment:
El barrendero se encontró con el cartero antes de que recogiera las cartas.
[The street sweeper met the postman before he fetched the letters.]El barrendero se encontró con el cartero antes de que recogiera la escoba.
[The street sweeper met the postman before he fetched the broom.]
Up until the point at which either las cartas [the letters] or la escoba [the broom] are heard, it is unclear who is doing the fetching. From a grammatical point of view, it could be either the street sweeper or the postman.
Participants were presented with Figure 2.4 as they were listening to either Sentence 1 or Sentence 2. At the same time, the researchers measured how long it took for the participants to look at the subject governing the verb recogiera. In other words, for Sentence 1, they were interested in how long it took participants to focus on the postman Playmobil figure and, in Sentence 2, on the street sweeper. Such fine measurements are made in milliseconds, i.e. in thousandths of seconds, using a special eye-tracking device.
Imagine that you want to run an experiment similar to the one carried out in Schimke et al. (2018). You can reuse the Playmobil image files created by the researchers as they helpfully uploaded them to the IRIS database.
In which file format do you think the images are archived? To find out, click here to go directly to the list of data and materials associated with the study. There are four entries in the IRIS database that are associated with this study. Select the “Pictorial” entry which contains the images. It allows you to download a ZIP file called Images_online.zip. ZIP is an archive file format that can contain one or more compressed files. Download this ZIP file.
Once the download was successful, navigate to the folder where the file was saved on your computer and unzip the file, i.e. decompress it and extract its contents:
- To unzip on Windows, double-click the
.zipfile- select ‘Extract All’,
- select a folder,
- and then click ‘Extract’.
- On a Mac, simply double-click the
.zipfile to unzip it. - If you are using the Linux command line, use the command
unzipfollowed by the name of the file to unzip it.
You should find that the ZIP file contains a folder entitled ‘Images’, which contains 58 pictures of different combinations of Playmobil figures that correspond to the experiment’s stimulus sentences.
Q2.6 In which file format are these Playmobil image files?
Image files typically contain metadata that is embedded in the image files themselves. This metadata may include the dimensions of the image and its colour profile. To view this metadata, right-click on one of the image files that you have extracted from the ZIP file and select the option to get more information about the file, e.g. “Get Info” or “Properties”.
Q2.7 How wide are these Playmobil images in pixel?
2.5 Working with tabular data
The measurements made by the eye-tracking device in Schimke et al. (2018)’s eye-tracking experiments were stored in the form of tables. Table 2.2 is an extract of a table that contains processed eye-tracking data from Schimke et al. (2018). It forms part of the study’s supplementary materials and can also be downloaded from the IRIS database.
In this table, each row corresponds to the data associated with one participant’s eye movements while listening to a single stimulus sentence and looking at the corresponding Playmobil image (e.g. Figure 2.4). The extract displayed as Table 2.2 only shows the data associated with the first six stimulus sentences (items) that participant “s1”, a Spanish L2 learner, listened to. The columns crit1, crit2 and crit3 contain values derived from the measurements made using the eye-tracking device.2 From Table 2.2, we can also see that participant “s1” was 19 years old when they started formally learning Spanish (AoO stands for “age of onset of formal instruction”) and that they were 20 when the experiment was conducted.
| language | subject | disambiguation | item | crit1 | crit2 | crit3 | AoO | age |
|---|---|---|---|---|---|---|---|---|
| S | s1 | 1 | 1 | 0.3451355 | -0.5618789 | 0.7036070 | 19 | 20 |
| S | s1 | 2 | 2 | -0.2679332 | -1.5849625 | 0.1852149 | 19 | 20 |
| S | s1 | 1 | 3 | -1.1563420 | 0.9898042 | -1.5849625 | 19 | 20 |
| S | s1 | 2 | 4 | -1.5849625 | -0.0874628 | -1.5849625 | 19 | 20 |
| S | s1 | 1 | 5 | 1.5849625 | 0.1831223 | 1.5849625 | 19 | 20 |
| S | s1 | 2 | 6 | -0.7824086 | -0.8548021 | -1.1758498 | 19 | 20 |
When working with data, tables are ubiquitous. Data stored in tables are called tabular data. Hence, learning to work with tabular data is a crucial data literacy skill.
In the language sciences, the results of most studies (whether experimental or corpus studies) are stored in tables. For example, when researchers conduct an online survey, the data collected by the online survey platform (e.g. Qualtrics, LimeSurvey, SoSci Survey) are automatically stored in the form of one or more table(s). These can then be exported from the survey platform in various tabular file formats (e.g. .csv, .json, .xlsx).
In some cases, data may be collected by analogue means, e.g. by getting participants to answer a paper questionnaire or collecting school children’s work on paper. However, for quantitative analysis, analogue research data are first digitalised. Then, the data are typically stored as text files in file formats such as .txt or .csv.
2.5.1 Delimiter-separated values (DSV) files
Tables can be stored in many data formats but the simplest and most widely used in linguistic research are text files with delimiter-separated values (DSV). For sharing and archiving research data, DSV files are favoured over formats specific to propriety software such as .xslx (Microsoft Excel files) or .numbers (Apple Numbers files). This is because DSV files can be “understood” by many different programs and on all operating systems. The fact that they are simple text files means that we will also be able to reliably read them in the future, even if programs such as Excel or Numbers have evolved or have been discontinued. Reliability and compatibility are fundamental to maintaining the integrity of research data and ensuring that data can be reused, even in the distant future.
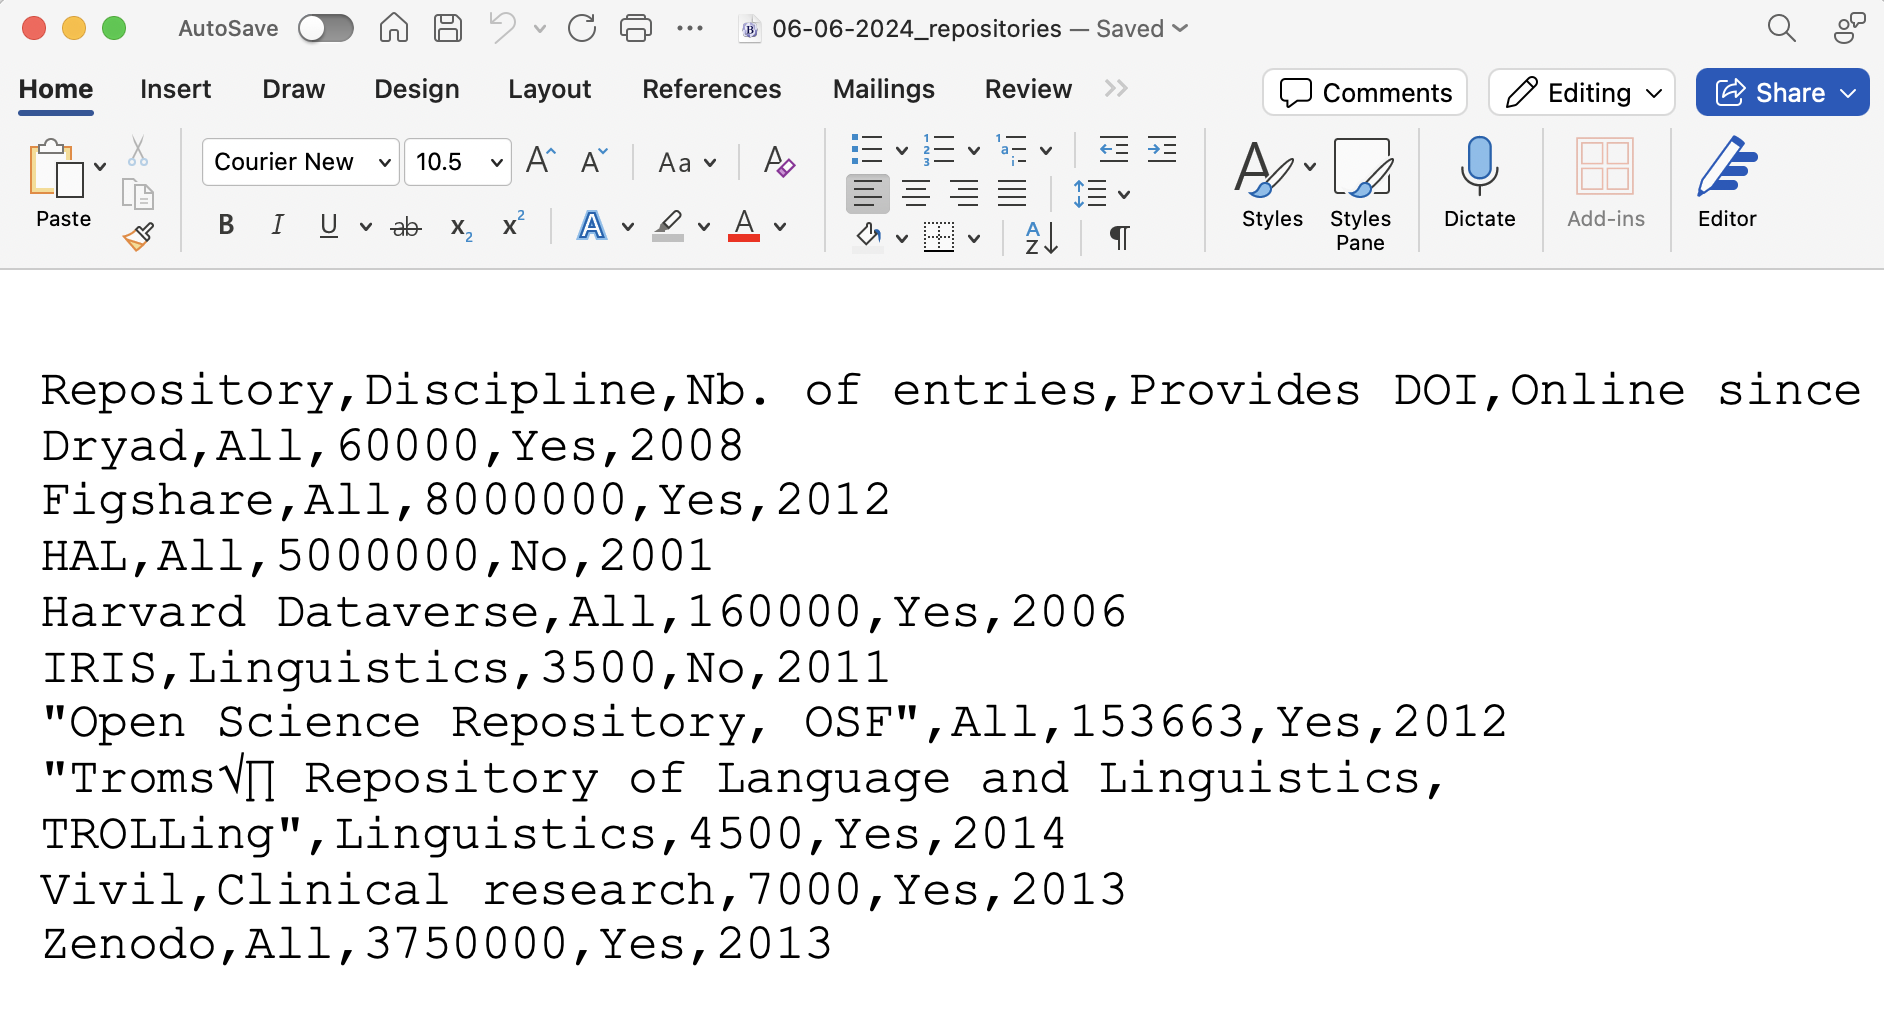
In DSV files, each value (e.g. measurement or response) is separated by a specific separator character. In principle, any character can be used to separate values, but the most common separators are the comma (,), tab (\t), colon (:), and semicolon (;). Below is the .csv file corresponding to Table 2.1.
Repository,Discipline,Nb. of entries,Provides DOI,Online since
Dryad,All,60000,Yes,2008
Figshare,All,8000000,Yes,2012
HAL,All,5000000,No,2001
Harvard Dataverse,All,160000,Yes,2006
IRIS,Linguistics,3500,No,2011
"Open Science Repository, OSF",All,153663,Yes,2012
"Tromsø Repository of Language and Linguistics,TROLLing",Linguistics,4500,Yes,2014
Vivil,Clinical research,7000,Yes,2013
Zenodo,All,3750000,Yes,2013
As you can see, the values are separated by commas.3 Additionally, some of the values are enclosed in, or delimited by, double quotation marks ("). This prevents any commas that may occur within an actual field value, e.g. the comma in the field Open Science Repository, OSF, from being interpreted as a separator character.
Given that DSV files are text files, it is possible to open them in a free plain-text editor (e.g. Notepad++ or BBEdit) or a text-processing program (e.g. Microsoft Word or LibreOffice Writer). However, these programmes will typically display DSV files as in Figure 2.5.
.csv file corresponding to Table 2.1 opened in Microsoft Word
We can probably agree that what we are seeing in Figure 2.5 is not a very reader-friendly way to display tabular data! This is why DSV files are more often opened in spreadsheet programs (e.g. LibreOffice Calc, Google Sheets, Microsoft Excel, Numbers) than in text-editing programs. Let’s find out how in the next section.
2.5.2 Opening DSV files in LibreOffice Calc
There are several ways to open a DSV file in LibreOffice Calc but the safest is to launch LibreOffice (see Task 1.1 in Section 1.2 if you have not yet installed LibreOffice) and, from the list of options under ‘Create’, click on ‘Calc Spreadsheet’ to open up a blank spreadsheet. Then, from the ‘File’ drop-down menu, select ‘Open…’ or use the keyboard shortcut Ctrl/Cmd + O and locate the DSV file that you wish to open.
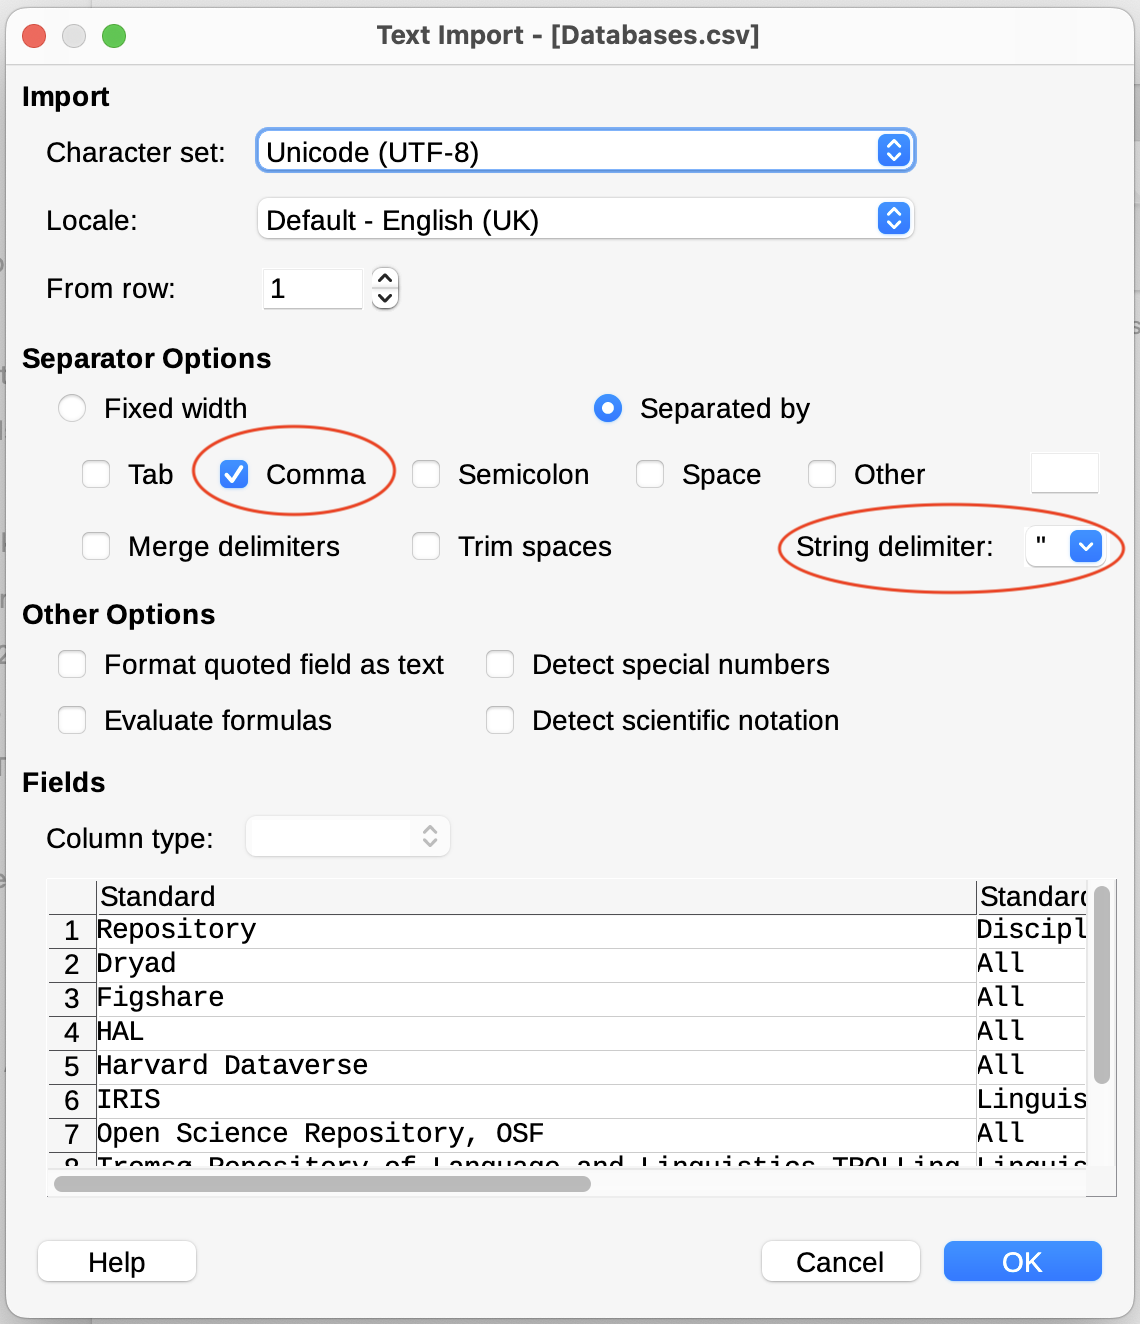
On opening a DSV file in LibreOffice Calc, we get a dialogue box with various options (see Figure 2.6).
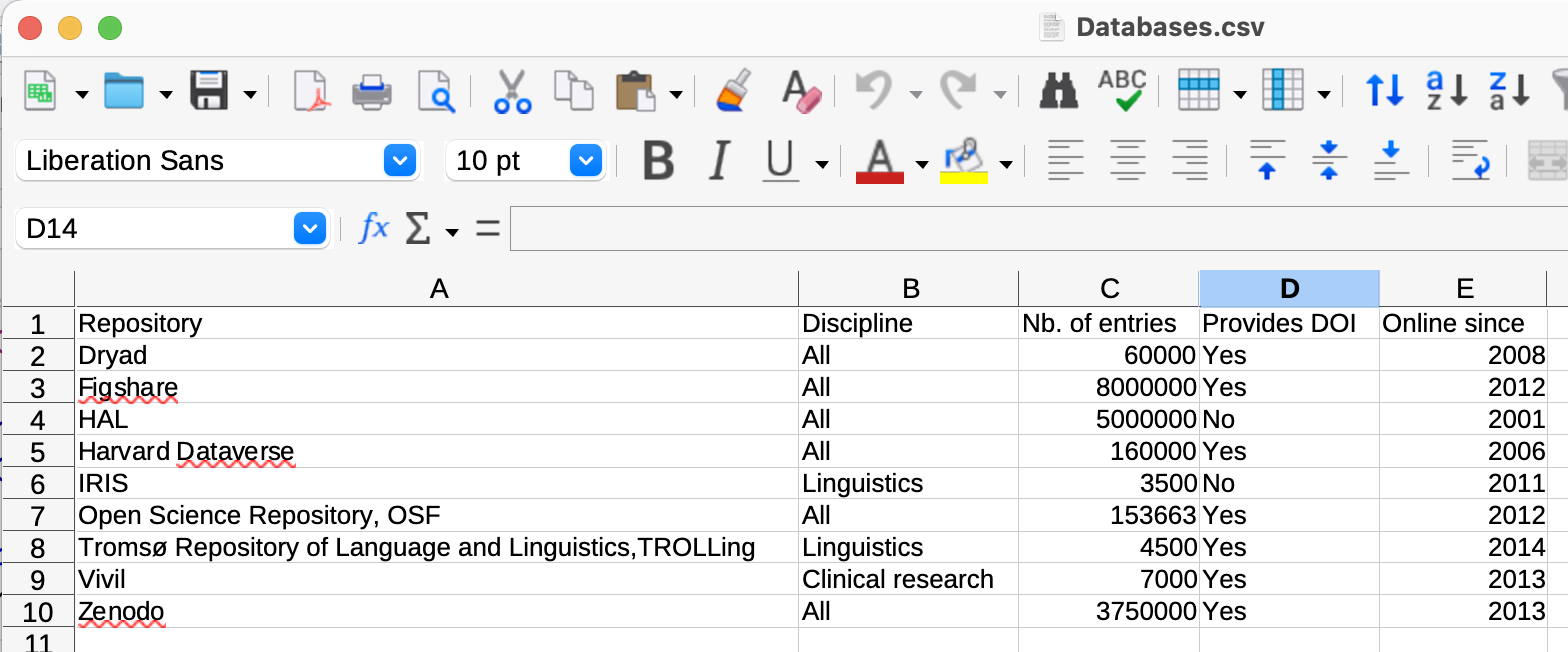
To correctly import this particular DSV file, it is necessary to specify that the separator character is the comma (,) and that the delimiter character is the double quotation mark (") (see selected options in Figure 2.6). With these settings in LibreOffice Calc, the table is rendered as in Figure 2.7.
Note that if you open a DSV file in Excel or Google Sheets, you will not be shown such a dialogue box. Instead, these programs assume that they can guess which separator and delimiter characters your file uses. Whilst this may, at first, sound convenient, this is not good news: you should be the one in control of how your data files are interpreted, not the program! In the next section, you will learn why opening DSV files such as .csv and .tsv files in Microsoft Excel, Google Sheets, or Numbers can be very dangerous. In some cases, these programs will ‘corrupt’, i.e. permanently damage, your DSV files, which can lead to irreversible data loss!
The bad news is that, if you are using Windows or MacOS, it is very likely that either Excel or Numbers is your default app to open DSV files. This means that if you double click on a .csv and .tsv file in your Finder/Explorer window, the file will likely automatically open up in either Excel or Numbers. This is why it is important you do not double-click on such files to open them: Opening a file just once with these programs can lead to data loss! If this happens to you with a file that you have downloaded from a repository, your best bet is to delete your local version of the file and download a fresh version so that you can start again from scratch.
In this task, we will practice opening a DSV file in LibreOffice Calc. Our example file is a real dataset from Schimke et al. (2018). We will begin by downloading it from the public repository IRIS.
In addition to the eye-tracking experiments, Schimke et al. (2018) conducted two further experiments in which participants completed a gap-filling task via an online survey platform. In the first of these experiments, the participants were native (L1) speakers of French, German, and Spanish. In the second, they were French- and Spanish-speaking learners (L2) of German.
In both experiments, the L1 and L2 participants were shown ambiguous sentences similar to the ones used in the eye-tracking experiment with the Playmobil images (see Note 2.1). After having read each stimulus, the participants were asked to complete a gap-fill task according to their understanding of the preceding ambiguous sentence. Participants were told “that there were no incorrect responses and that they should answer spontaneously” (Schimke et al. 2018: 755). Below is an example questionnaire item in the three languages examined:
1. Der Briefträger ist dem Straßenfeger begegnet, bevor er schnell ein Sandwich geholt hat. ___________________ hat ein Sandwich geholt.
2. Le facteur a rencontré le balayeur avant qu’il prenne rapidement un sandwich. ___________________ a pris un sandwich.
3a. El cartero se reunió con el barrendero antes de que él recogiera velozmente un emparedado. ___________________ recogió un emparedado.
3b. El cartero se reunió con el barrendero antes de que recogiera velozmente un emparedado. ___________________ recogió un emparedado.
Note that, for Spanish, there were two types of stimuli: one with an overt pronoun (as in 3a. with él) and one without (as in 3b. with a null pronoun), as both variants are possible in Spanish. All three examples translate as:
- The postman encountered the street sweeper before he quickly fetched a sandwich. ___________________ fetched a sandwich.
To complete the gap, participants could either select ‘The postman’ or ‘The street sweeper’.
- Go back to the study’s page on IRIS and select the second entry entitled ‘Other questionnaire’ which, among other things, contains ‘Written production data’.
Note that this database entry includes both research data and research materials: the file sentences_offline_task.xlsx contains the full list of questionnaire items, including both experimental and filler items, with which we could reconstruct the experiment to replicate it with a new set of participants. For now, however, we are not interested in obtaining materials to replicate the study, but rather in examining the study’s original data.
This IRIS entry also contains three data files. The last file (logoddslearnersfinal.txt) is the DSV file that was used to create Table 2.2 above.
In this task, we are going to look at the questionnaire data corresponding to the gap-filling task experiment conducted with German L2 learners, which is contained in the data file offlinedataLearners.txt:
- Download the
offlinedataLearners.txtfile (which is the second listed) and save it on your computer (see Section 3.3). - Launch LibreOffice (see Section 1.2 if you have not yet installed LibreOffice) and, from the list of options under ‘Create’, click on ‘Calc Spreadsheet’ to open up a blank spreadsheet.
- From the ‘File’ drop-down menu, select ‘Open…’ or use the keyboard shortcut ‘Ctrl/Cmd + O’. Find
offlinedataLearners.txtin the folder where you saved it and click on ‘Open’. - A ‘Text Import’ dialogue box will pop up. This a DSV file, not a fixed-width file, so ensure that the option ‘Separated by’ is selected. If not already set by default, it is also a good idea to select ‘Unicode (UTF-8)’ for the ‘Character set’.
- Experiment with the different ‘Separator Options’ until the preview at the bottom of the dialogue box looks like a table.
- Ensure that, apart from the ‘Separator Options’, all other options in the dialogue box are unselected and then click on ‘OK’.
Q2.8 What is the separator character in the file offlinedataLearners.txt?
Q2.9 What is the delimiter character in the file offlinedataLearners.txt?
Q2.10 How many observations does the file offlinedataLearners.txt contain?
Q2.11 In this table, what does each observation correspond to?
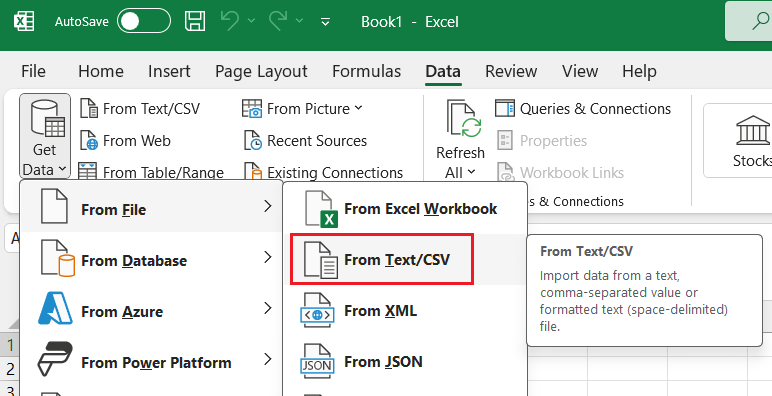
If you absolutely must open a DSV file (e.g. a .csv or .tsv file) in Excel (for example because you do not have sufficient permissions to install LibreOffice on the computer that you are using), do not open the file by double clicking on the file as this will automatically trigger Excel’s problematic auto-formatting behaviour (see Section 2.6)! Instead, first launch Excel and create a new blank workbook. Then navigate to the ‘Data’ tab, select the ‘Get Data’ option, and then ‘From Text/CSV’ (see Figure 2.8). In the following dialogue, you can specify how the data should be imported. The options are very similar to the ones offered in LibreOffice (see above).
Note that with this method it may be possible to prevent Excel from automatically (and irreversibly!) applying transformations to your data. However, sadly, this may not suffice. Read on to find out more…
2.6 A word of warning about spreadsheet programs ⚠️️
You should be aware that opening DSV files in spreadsheet programs can corrupt the files! Once a file is corrupted, it is often not possible to retrieve the original data so this is very bad news, indeed. Such problems are particularly frequent when opening DSV files with Microsoft Excel and Google Sheets. This is because the default settings in these programs surreptitiously modify files upon opening.
These ‘auto-format’ modifications include replacing certain values by dates (e.g. changing 3-4 to March, 4th) or numbers (e.g. changing 1.23E5 to 123000)4, removing leading zeros (e.g. changing 001 to 1), or misinterpreting certain characters (e.g. the value -ism will generate an error because the hyphen is interpreted as minus sign).
Not only can these auto-format modifications lead to inaccurate data analysis but, in the worst of cases, they can even cause data loss. The crux of the problem is that often users do not realise what the program has done in the background. How bad can this be? Find out by completing the task below.
In this task, you will find out how genetics researchers who use spreadsheets for their analyses regularly have their data so badly damaged that it affects the results of their publication. Though we have no statistics on how spreadsheet errors affect the work of linguists, it is (unfortunately) very likely to be just as bad as in genetics.
Ziemann, Eren & El-Osta (2016) reported that a fifth of genetics publications with supplementary .xls or .xlsx files with gene lists contained errors caused by Excel’s auto-formatting behaviour. The results of this study shocked the research community and a report about it went viral. Click on the link below to read the open-access article “Gene name errors: Lessons not learnt” by Abeysooriya et al. (2021) to find out whether the situation has improved since 2016 and answer the questions below.
Abeysooriya, Mandhri, Megan Soria, Mary Sravya Kasu & Mark Ziemann. 2021. Gene name errors: Lessons not learned. PLOS Computational Biology. Public Library of Science 17(7). e1008984. https://doi.org/10.1371/journal.pcbi.1008984.
Q2.12 Has the proportion of genetics publications with Excel gene lists affected by auto-formatting errors decreased since 2016?
Q2.13 Does using LibreOffice Calc (see Section 1.2) also cause these same issues?
Q2.14 Did highly reputable journals publish fewer articles with erroneous Excel gene lists?
It is worth noting that, for some Windows users, these auto-formatting issues can corrupt files that they have never actively opened in Excel! 🤯️ This happens when Windows applies Excel’s default settings to all CSV files, regardless of what program they are actually opened with. To ensure that this does not happen to you, check that Excel is definitely not your default app to open .csv and .tsv files (see below for instructions).
.csv or .tsv file in LibreOffice from a File Finder/Explorer window
Remember that to open a .csv or .tsv file on your computer, should never ever double-click on it and let the default program open it! As we saw in Section 2.6, this can break or ‘corrupt’ the file. To avoid accidentally double-clicking on a .csv or .tsv file and having the file corrupted, I recommend making either LibreOffice or a plain-text editor (e.g. Notepad++ or BBEdit) your default application to open up such files.
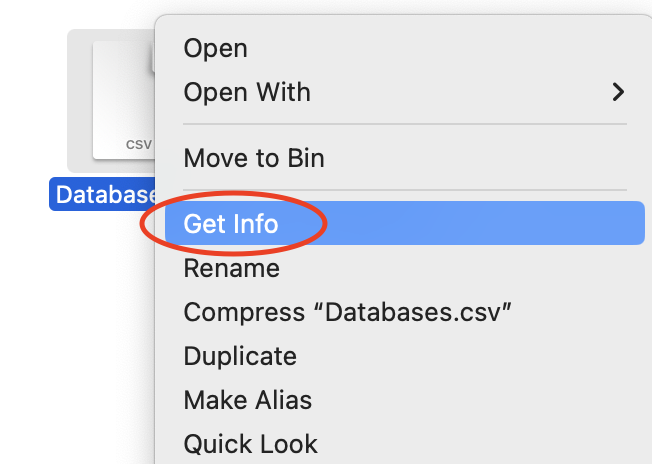
On MacOS, you can change the default application used to open files of any file extensions by right-clicking a file name with this particular extension and than selecting ‘Get Info’ (Figure 2.9 (a)). In the example below, Numbers is the default application for all .csv files (see Figure 2.9 (b)). In the dropdown menu ‘Open with:’, you can then select LibreOffice (provided you have installed it beforehand!) and finally click on ‘Change All…’ (Figure 2.9 (c)). You will be asked to confirm your choice.
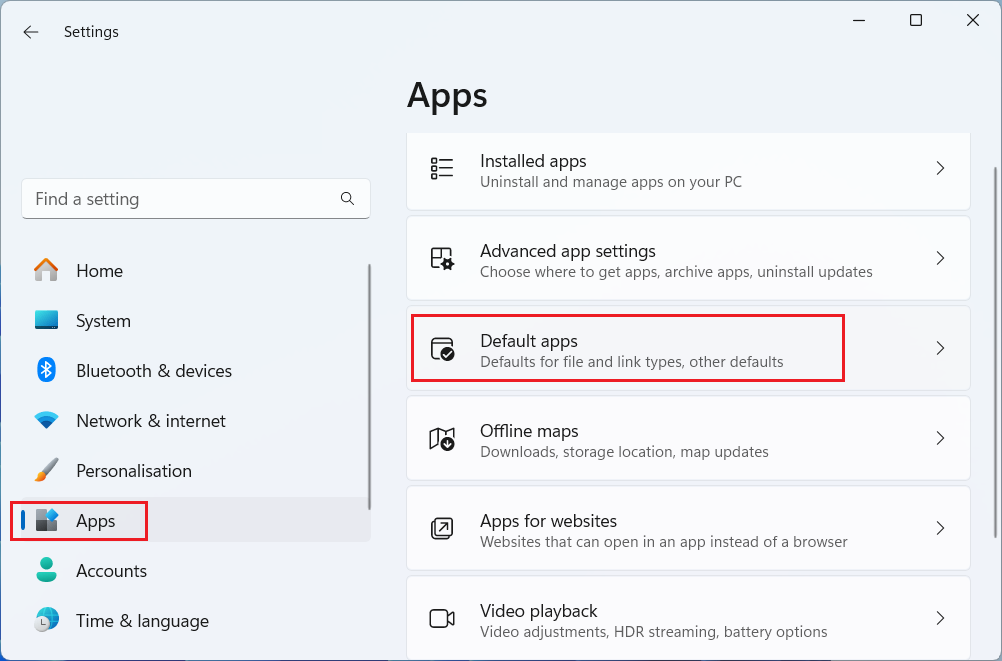
If your operating system is Windows, you should look in your Windows’ settings for the option ‘Default Apps’ (see Figure 2.10).
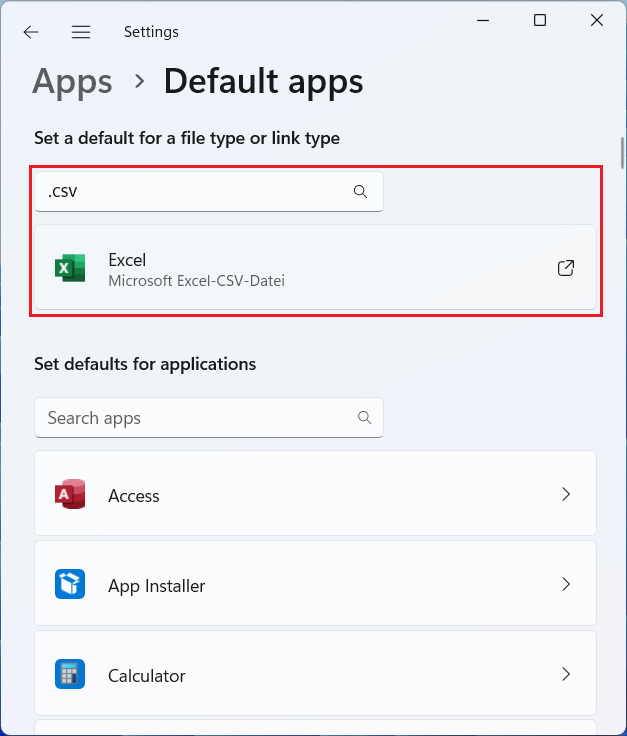
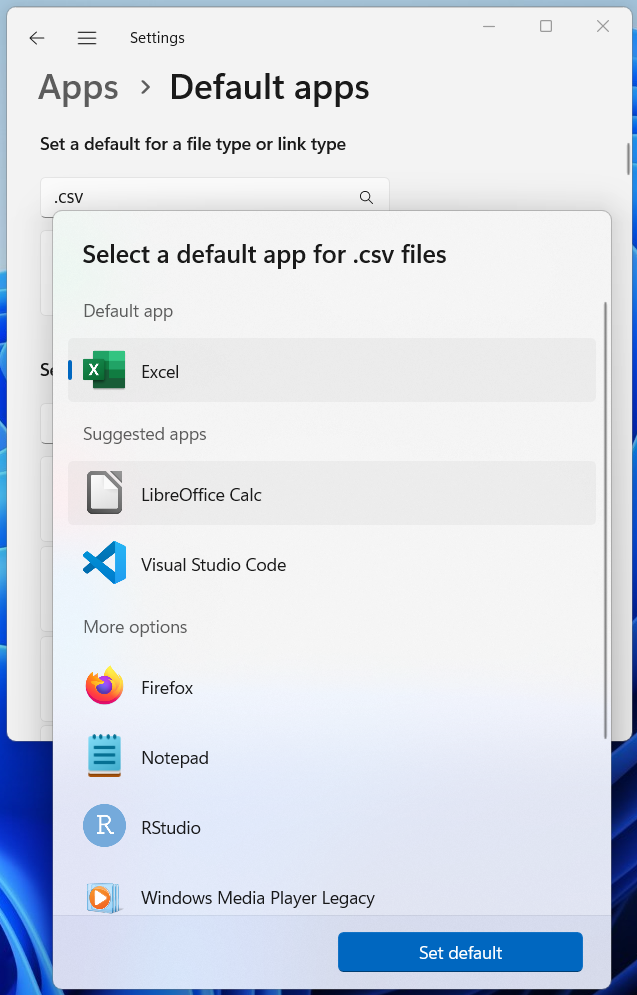
In the next step, select ‘Choose default apps by file type’. Here, you can search for .csv as a file type, and choose which program you want to set as the default program for opening .csv files. If Excel is currently your default (as in Figure 2.11 (a)), you can click on Excel and choose a different program. LibreOffice is a sensible, open-source alternative (see Figure 2.11 (b)). A plain-text editor such as Notepad would also be fine (also listed on Figure 2.11 (b)).
.csv files in Windows
If it is not possible to adjust the default app settings, either due to insufficient permissions or because you only have temporary access to this PC, do not to open .csv or .tsv files with the default program. Instead, right-click on the file name and, using the ‘Open with’ option, select the option to open the file with LibreOffice, if available, or else with a plain-text editor.
Check your progress 🌟
You have successfully completed 0 out of 14 questions in this chapter.
Are you confident that you can…?
In Chapter 3, you will learn how to name, save, and back-up research data files so as to facilitate sound data analysis.
Note that, for some repositories, the number of entries includes other types of research outputs, e.g. preprints and figures.↩︎
Details of what these values mean are not relevant here but, for those of you who are curious, they correspond to the “log odds of looks” that participant made towards one or the other Playmobil figure whilst listening to the experimental stimulus sentences at three time points, called “critical regions”. These critical regions include the time window between the onset of the pronoun and 480 milliseconds after the onset of the disambiguating information. Schimke et al. (2018: 768–769) explain that “[a] positive value of the log odds indicates more looks to the subject than to the object antecedent, while a negative value indicates the reverse pattern.”↩︎
Note that the file extension
.csvstands for “comma-separated values”. Confusingly, however, DSV files are often given a.csvextension even when the separator character is not the comma. As a result, even though the.tsvextension stands for “tab-separated values”,.csvfiles are frequently separated by a tab (\t) rather than comma. Isn’t that fun? 🙃↩︎In scientific notation, “E” stands for “exponent”, which refers to the number of times a number needs to be multiplied by 10. This notation is used as a shorthand way of writing very large or very small numbers. This is why “1.23E5” is interpreted by Excel as 1.23 multiplied by 10 to the power of 5, which is to say: 1.23 multiplied by 100,000. This operation shifts the decimal point five places to the right, resulting in the number 123000.↩︎
