🐭 Click on the mouse for a hint.
Ch. 8: Tasks & Quizzes
TipYour turn!
Q8.1 What was the mean English collocation test score (Colloc) of the L1 participants in Dąbrowska (2019)?
Q8.2 What was the mean English collocation test score (Colloc) of the L2 participants?
🐭 Click on the mouse for a hint.
TipYour turn!
Q8.3 What was the median English collocation test score (Colloc) of the L1 participants in Dąbrowska (2019)?
🐭 Click on the mouse for a hint.
Q8.4 What was the median English collocation test score (Colloc) of the L2 participants in Dąbrowska (2019)?
🐭 Click on the mouse for a hint.
TipYour turn!
In comparative studies, it is important to ensure that comparisons are fair and meaningful. For example, it would probably not be very meaningful to compare the linguistic knowledge of a group of undergraduate student learners of English with a group of retired native speakers. In this quiz, you will examine how similar the L1 and the L2 participants in Dąbrowska (2019) were in terms of age.
Q8.5 What was the mean age of the L1 participants in Dąbrowska (2019)? Use the round() function to round off the mean value to two decimal places (see Piped Functions for a reminder as to how to combine two functions).
🐭 Click on the mouse for a hint.
Q8.6 On average, were the L1 participants older or younger than the L2 participants in Dąbrowska (2019)?
🐭 Click on the mouse for a hint.
Q8.7 Which of the following statements is true about the L1 and L2 participants in Dąbrowska (2019)?
😇 Hover for a hint
TipYour turn!
Does the distribution of L1 participants’ ages follow a similar shape to the L2 participants (see Figure 8.6)? Are we dealing with a distribution that is normal, left or right skewed, or something entirely different?
Q8.8 What are the modal ages of the L1 and L2 participants in Dąbrowska (2019)?
🐭 Click on the mouse for a hint.
Q8.9 Which of the following statements is true?
Q8.10 Which measure of central tendency best describes L1 participants’ ages?
TipYour turn!
Q8.11 What can we reasonably deduce from the distribution of L1 participants’ ages visualised in Figure 8.8?
🐭 Click on the mouse for a hint.
Q8.12 What are the pros of reporting the median rather than the mean to describe the central tendency of a variable?
🐭 Click on the mouse for a hint.
Q8.13 What are the cons of reporting the median rather than the mean to describe the central tendency of a variable?
🐭 Click on the mouse for a hint.
TipYour turn!
Q8.14 Complete the description of the GrammarR variable in L1.data and L2.data below.
Copy and paste the following paragraph into a text processor (e.g. LibreOffice Writer or Microsoft Word) and fill in the six blanks using figures that you calculated in R. If necessary, round off values to two decimal places.
On average, English native speakers performed only marginally better in the English grammatical comprehension test (median = ______) than English L2 learners (median = ______). However, L1 participants’ grammatical comprehension test results ranged from ______to ______, whereas L2 participants’ results ranged from ______to ______.
NoteClick here for the solution to Q8.14
Your paragraph should read as follows:
On average, English native speakers performed only marginally better in the English grammatical comprehension test (median = 76) than English L2 learners (median = 75). L1 participants’ grammatical comprehension test results ranged from 58 to 80. In this same test, L2 participants’ results ranged 40 to 80.
The following lines of R code can be used to obtain these numbers.
median(L1.data$GrammarR)[1] 76median(L2.data$GrammarR)[1] 75min(L1.data$GrammarR)[1] 58max(L1.data$GrammarR)[1] 80min(L2.data$GrammarR)[1] 40max(L2.data$GrammarR)[1] 80
TipYour turn!
Q8.15 Examine the boxplots displayed in Figure 8.12.
🐭 Click on the mouse for a first hint.
Q8.16 The boxplots below are based on the same data as the three density plots in Figure 8.9. Compare the two figures. Which distribution corresponds to which boxplot?
🐭 Click on the mouse for a hint.
Q8.17 Examine the following distribution of scores on the grammatical comprehension test administered as part of Dąbrowska (2019).
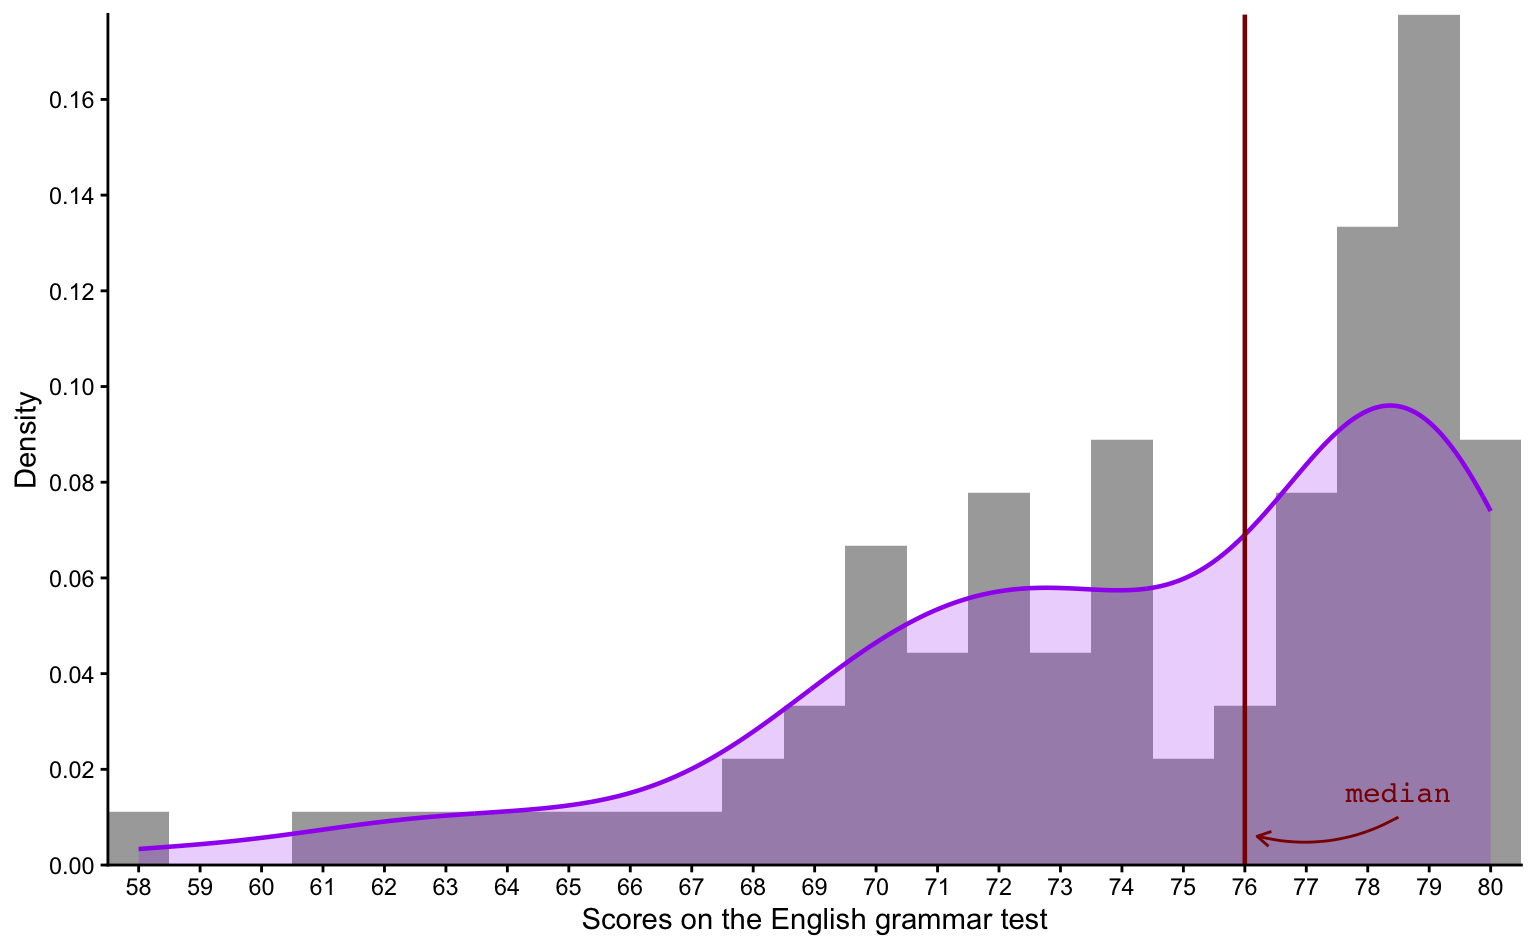
Are the scores visualised in the plot above normally distributed?
🐭 Click on the mouse for a hint.
Q8.18 Compare the following outputs of the summary() function.
summary(L1.data$GrammarR) Min. 1st Qu. Median Mean 3rd Qu. Max.
58.00 71.25 76.00 74.42 79.00 80.00 summary(L2.data$GrammarR) Min. 1st Qu. Median Mean 3rd Qu. Max.
40.00 58.50 75.00 67.76 78.00 80.00 Based on the outputs of the summary() function, what does the plot above display?
Q8.19 Compare the following boxplots which summarise the distribution of scores on the grammatical comprehension test (GrammarR) administered as part of Dąbrowska (2019).
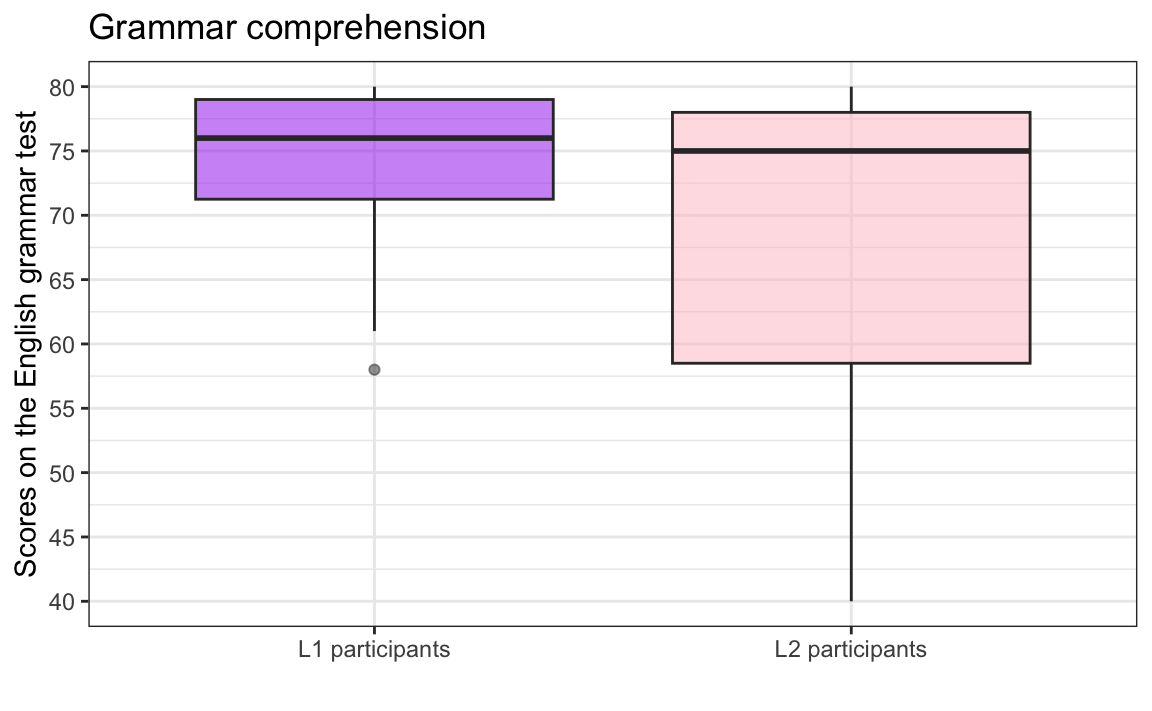
Why do the two boxplots look so different?
🦉 Hover over the owl for a hint.
🐭 Click on the mouse for a second hint.
TipYour turn!
Q8.20 What is the standard deviation of L1 participants’ age in Dąbrowska (2019)? Calculate the sample standard deviation to two decimal places.
🐭 Click on the mouse for a hint.
Q8.21 Compare the standard deviation of the Age variable in the L1 and L2 datasets. What can you conclude on the basis of this comparison?
🐭 Click on the mouse for a hint.
Check your progress 🌟
You have successfully completed 0 out of 21 questions in this chapter.